Self-Healing Rails: I Let Claude Fix My Production Errors for a Month, Then Turned It Off
There I was, staring at a Sentry error email, about to click through and start the familiar ritual: read the stack trace, figure out what happened, write a fix, open a PR, deploy. The usual.
Then I stopped myself. Hold on. I’m a vibe coder now. I don’t debug, I manifest solutions.
Why am I doing this? What if Claude could keep an eye on the logs, spot errors, and fix them without ever asking me?
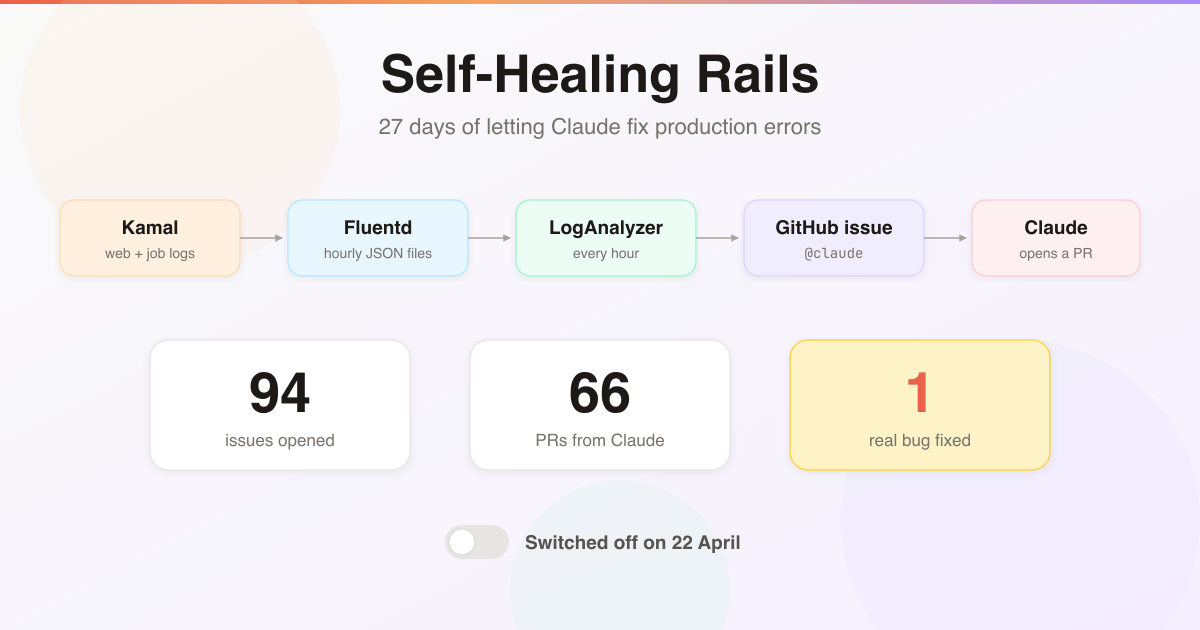
So I built exactly that for DineHere, a Rails 8.1 app deployed with Kamal. It ran for 27 days. It opened 94 GitHub issues and 66 pull requests. Then I turned it off.
This is the whole story: how the pipeline worked, the one time it was genuinely brilliant, and why the rest of the time it was mostly busy fixing itself.
The Numbers
Before the build, here’s how it ended up:
- 27 days running, from 26 March to 22 April 2026
- 94 GitHub issues opened
- 66 pull requests opened by Claude
- 14 PRs merged
- 1 PR that fixed a real bug in the app
- 13 PRs that tuned the log analyzer’s own filters
- 2 real bugs found but never merged
Hold on to that ratio. We’ll come back to it.
The First Problem: Getting Access to the Logs
Before Claude can fix anything, it needs to see the errors. Sounds simple. It wasn’t.
Attempt 1: Rails logger. My first thought was to add a custom logger in Rails that could capture errors and pipe them somewhere useful. But Rails only logs what Rails knows about. It misses Docker-level output, boot errors, accessory crashes, anything that happens outside the Rails process. If Puma fails to start, Rails isn’t going to tell you about it because Rails isn’t running.
The real need: I wanted to see everything printed to Docker stdout/stderr. The full picture.
The constraint: There’s no way to access Docker logs from within the container. docker logs is a host command. I could have written a script that runs on the host and tails Docker logs, but that’s a host-specific solution. It doesn’t travel with the app. If I spin up a new server or add a second one, I’d have to set it all up again.
I wanted something that lives in the Kamal deploy config. Something that’s part of the app’s infrastructure, not the server’s.
The answer: Fluentd as a Kamal accessory. Fluentd runs as a sidecar container alongside the app. Docker’s logging driver sends all container output to Fluentd, and Fluentd writes hourly JSON files to a shared volume. The app containers mount that volume read-only, so any Rails code can read every log line from every container.
Making Fluentd Actually Work with Kamal
This part took more commits than I’d like to admit.
Setting up the logging driver was straightforward. In config/deploy.yml, tell all containers to send their logs to Fluentd instead of Docker’s default json-file driver:
logging:
  driver: fluentd
  options:
    fluentd-address: "127.0.0.1:24224"
    fluentd-async: "true"
    fluentd-retry-wait: "1s"
    fluentd-max-retries: "30"
    tag: "docker.{{.Name}}"
The fluentd-async: "true" is important. Without it, if Fluentd is temporarily down, your app containers block on every log line. I learned this the hard way when I originally used fluentd-async-connect (which isn’t the right option name) and containers would hang on startup if Fluentd wasn’t ready yet.
The Fluentd accessory itself is minimal:
accessories:
  fluentd:
    image: fluent/fluentd:v1.18-1
    host: 203.0.113.10
    port: "127.0.0.1:24224:24224"
    volumes:
      - dinehere_fluentd_logs:/fluentd/log
      - /etc/localtime:/etc/localtime:ro
    files:
      - config/fluent.conf:/fluentd/etc/fluent.conf:ro
And the Fluentd config (config/fluent.conf) collects everything into hourly JSON files:
<system>
  suppress_config_dump true
</system>

<source>
  @type forward
  bind 0.0.0.0
  port 24224
</source>

<match docker.**>
  @type file
  path /fluentd/log/dinehere
  include_tag_key true
  tag_key tag
  <buffer time>
    @type file
    path /fluentd/log/buffer/dinehere
    timekey 3600
    timekey_wait 10m
    flush_mode interval
    flush_interval 10s
  </buffer>
  <format>
    @type json
  </format>
</match>
The flush_mode interval and flush_interval 10s lines were added after logs simply didn’t show up. Without them, Fluentd buffers everything and only writes when the hour (timekey) closes, plus the 10 minute timekey_wait.
Then came the volume permission saga. Fluentd writes to /fluentd/log, and the app containers read those files from /rails/fluentd-logs. Both mount the same Docker volume (dinehere_fluentd_logs). Simple, right?
Except Fluentd’s container runs as a non-root user, and the volume permissions didn’t play nice. I went through several rounds: root startup with su-exec, removing UID overrides, removing the volume mount entirely to isolate the issue, and finally getting it working with a clean volume name. The app mounts it read-only:
volumes:
  - "dinehere_storage:/rails/storage"
  - "dinehere_fluentd_logs:/rails/fluentd-logs:ro"
This produces files like dinehere.2026032701_0.log, one set per hour, with each line a JSON object containing the timestamp, container tag, and log output.
Detecting Errors and Creating GitHub Issues
Now the app can read every log line. Next: find the errors and tell someone about them.
LogAnalyzer scans the recent Fluentd files and pulls out error lines with their stack traces. Here’s the core of it:
class LogAnalyzer
  ERROR_PATTERNS = /\b(error|fatal|exception)\b/i
  NOT_FOUND_PATTERN = /Completed 404|status=404/
  STACKTRACE_CONTINUATION = /\A\s+(from |\/|#)/

  # Errors matching any of these patterns are silently ignored
  IGNORE_PATTERNS = [
    /Unable to proxy request.*connection refused/, # Rails unavailable during deploy restart
    /Failed to open TCP connection to.*sentry\.io/, # Transient Sentry connectivity
    # ...
  ].freeze

  # Paths for which error/404 lines are ignored (scanners, bots, known missing routes)
  IGNORED_404_PATHS = [
    "/.env", "/.git", "/actuator", "/administrator", "/config.php",
    "/internal/tls/verify", # Caddy on-demand TLS checks; 404 = don't issue cert
    # ...
  ].freeze

  def initialize(log_dir: nil, hours: 2)
    @log_dir = log_dir || default_log_dir
    @hours = hours
  end

  def analyze
    results = {}
    files = recent_log_files

    files.each do |file|
      errors = extract_errors(file)
      results[File.basename(file)] = errors if errors.any?
    end

    enrich_with_request_context(results, files)
  end

  private

  def recent_log_files
    cutoff = @hours.hours.ago

    Dir.glob(File.join(@log_dir, "dinehere*.log")).select do |f|
      # Fluentd filenames: dinehere.YYYYMMDDHH_chunk.log
      if (match = File.basename(f).match(/\.(\d{4})(\d{2})(\d{2})(\d{2})_\d+\./))
        Time.utc(*match.captures.map(&:to_i)) >= cutoff
      else
        true
      end
    end
  end

  # extract_errors walks each JSON line, starts a new error when a line matches
  # ERROR_PATTERNS or NOT_FOUND_PATTERN (and isn't ignored), and appends stack
  # trace lines that follow it.
  #
  # enrich_with_request_context greps every file for the error's request ID,
  # so the issue shows the whole request, not just the line that failed.
end
Keep an eye on ERROR_PATTERNS and those two ignore lists. They turn out to be the main character of this story.
The hourly job runs on Solid Queue’s recurring schedule, and looks back two hours each time:
# config/recurring.yml
production:
  analyze_logs:
    class: Logs::AnalyzeJob
    schedule: every hour
module Logs
  class AnalyzeJob < ApplicationJob
    limits_concurrency to: 1, key: -> { "logs_analyze" }
    discard_on StandardError

    LOOKBACK_HOURS = 2

    def perform
      results = LogAnalyzer.new(hours: LOOKBACK_HOURS).analyze
      return if results.empty?

      github = GithubIssueService.new
      already_reported = github.reported_files(label: "log-analysis")
      results.reject! { |filename, _| already_reported.include?(filename) }
      return if results.empty?

      github.create(
        title: "Production Log Analysis - #{Time.current.strftime("%Y-%m-%d %H:%M UTC")}",
        body: format_body(results),
        labels: [ "log-analysis" ]
      )
    end
  end
end
Deduplication was critical. With a two hour lookback and an hourly schedule, every file gets scanned twice, and the same error would open a new issue every hour. The fix: each issue body starts with an HTML comment listing which log files it covers:
<!-- reported-files:dinehere.2026033012_38.log,dinehere.2026033012_39.log -->
GithubIssueService is a small Faraday wrapper around the GitHub API. Before creating an issue, it reads every log-analysis issue (open and closed) and collects the files already reported:
def reported_files(label:)
  response = connection.get("/repos/#{@repo}/issues") do |req|
    req.params = { labels: label, state: "all", per_page: 100 }
  end

  response.body.flat_map do |issue|
    if (match = issue["body"]&.match(/<!-- reported-files:(.+?) -->/))
      match[1].split(",")
    else
      []
    end
  end
end
The issue body then lists the errors, a short block of app context (stack, architecture, key services, external APIs), and instructions that mention @claude. That mention is what triggers the next step.
Claude Takes Over
A GitHub Actions workflow listens for issues that mention @claude:
# .github/workflows/claude.yml
on:
  issues:
    types: [opened, assigned]
  issue_comment:
    types: [created]

jobs:
  claude:
    if: contains(github.event.issue.body, '@claude')
    runs-on: ubuntu-latest
    steps:
      - uses: actions/checkout@v4
      - uses: anthropics/claude-code-action@v1
        with:
          claude_code_oauth_token: ${{ secrets.CLAUDE_CODE_OAUTH_TOKEN }}
          claude_args: '--allowedTools "Bash(git:*)" "Bash(bin/rails test:*)" "Bash(bin/rubocop:*)" "Bash(bin/brakeman:*)" "Bash(gh issue:*)" "Read" "Edit" "Write" "Glob" "Grep"'
Claude gets the whole codebase but a short list of tools. It can read, edit, run tests and linters, and use git and the GitHub CLI. It can’t run arbitrary commands.
The instructions in the issue started as five rules: read CLAUDE.md, find the root cause, open a PR if it’s fixable, close the issue if it’s transient, and always take a closing action. By the end there were nine. Every new rule was a patch for something that had gone wrong:
- “NEVER commit directly to main.” Added, in capitals, after it did.
- “You MUST take exactly one closing action.” Without it, issues piled up that Claude had looked at and walked away from.
- “Group duplicate errors.” The same error 30 times got 30 paragraphs of analysis.
- “Check whether the fix already exists on main.” Because it kept opening a second PR for a fix that was merged but not yet deployed.
- “If you find a benign pattern, add it to
IGNORE_PATTERNS.” And “use full specific paths, never wildcards” forIGNORED_404_PATHS.
That last pair is where things started to go sideways. But first, the good part.
The Full Pipeline
Kamal containers (web + job)
  │ Docker fluentd logging driver
  ▼
Fluentd accessory
  │ hourly JSON, shared volume
  ▼
Logs::AnalyzeJob (every hour)
  │ LogAnalyzer finds new errors
  ▼
GithubIssueService
  │ opens an issue with @claude
  ▼
Claude Code Action
  │ writes fix + tests, opens PR
  ▼
I review and merge
When It Worked
On 30 March, Marketing::Images::ProcessJob was replacing image blobs, and each replacement enqueued a WarmCloudflareCacheJob with the blob as a GlobalID argument. By the time the cache warmer ran, the original blob had already been deleted, so the job couldn’t load its argument.
Here’s how that played out:
- 10:00 to 12:00 UTC. 38
ActiveJob::DeserializationErrorerrors land in the logs. Nobody notices. - 12:00:02. The hourly job opens issue #106 with all 38 errors, each with its full request context.
- 12:02:53. Claude opens PR #107. Its summary nails the root cause: the job is enqueued with an
ActiveStorage::Blob, and the blob is gone before the job runs. The fix passes the blob’s proxy path as a plain string instead, so there’s nothing to deserialize. It updates the job’s test too. - 12:58. I review and merge.
Under three minutes from issue to a correct PR with tests, and I never opened a log file. That’s the dream, and for this one bug it was exactly as good as I’d hoped.
It was also the only time it happened.
When It Didn’t
Of the 14 PRs I merged, that was the only one that fixed the app. The other 13 tuned the log analyzer itself: ignore this 404, ignore that timeout. The 52 PRs I didn’t merge were mostly the same thing, again and again.
ERROR_PATTERNS matched the word “error”, not errors. Bots probe every site for /error.log, /logs/error.log, /config/error.js and /error/. Each probe contains the word “error”, so each one became a production error. Claude opened at least ten separate PRs to ignore /error.log alone. My own admin log viewer, which filters by ?status=error, set it off too.
Expected failures looked like failures. A directory pipeline in the app runs Google Lighthouse and SSL checks against restaurant websites. Plenty of those sites are broken, so those checks should fail and log it. Claude opened 13 PRs asking to ignore them. Then a PageSpeed timeout. Then a Paddle timeout. Then InvalidAuthenticityToken, twice.
Every issue got a fresh Claude. Each Action run starts from a clean checkout with no memory of the last one. It didn’t know that an almost identical PR was already open, so it opened another. The “check main first” rule only helped once a fix was merged.
The analyzer was being edited by the thing it reported to. Most of Claude’s output was changes to log_analyzer.rb. A tool whose job is to find problems was mostly being taught by an agent what not to look at, one regex at a time.
By 8 April there were 11 open Claude PRs and 12 open issues, all slices of the same two root causes. I closed them all and fixed it properly in one PR: the ignore lists now applied to both the error check and the 404 check, the transient proxy patterns covered every path, and Rack::Attack blocked the scanner paths before Rails ever saw them.
And the real bugs got lost in the noise. On 13 April, Claude found two real ones:
ReadyComponentcrashed withNoMethodErrorwhen a restaurant was ready but had no accepted website yet. The fix was a one-linepresent?check. But it was in a PR that also added four scanner paths to the ignore list.- PageSpeed screenshots shorter than 800px raised
Vips::Error: extract_area: bad extract area. The fix replacedresize_to_limitpluscropwithresize_to_fill.
Both PRs sat open next to a dozen “ignore Lighthouse errors” PRs. Both were closed as stale nine days later, when I switched the whole thing off today. The pipeline did its job. I just couldn’t see it any more.
Unexpected Bonus: Hardening Your App
One thing did stick. Once you’re reading every log line, you see the junk: bots hitting /wp-admin, probing for .php and .asp files, hunting for exposed .env files. None of it has anything to do with your app, but all of it reaches your router and fills your logs.
Instead of teaching the analyzer to ignore it, block it before it reaches Rails. This is the Rack::Attack blocklist I ended up with, and it’s still running today:
# config/initializers/rack_attack.rb
Rack::Attack.blocklist("block-bad-paths") do |req|
  path = req.path.to_s.downcase
  path.end_with?(".php") ||
    path.end_with?(".asp") ||
    path.end_with?(".aspx") ||
    path.end_with?(".cgi") ||
    path.end_with?(".env") ||
    path.end_with?(".log") ||
    path.end_with?(".sql") ||
    path.include?("wp-admin") ||
    path.include?("wp-login") ||
    path.include?("wp-content") ||
    path.include?("/.git") ||
    path.start_with?("/_next/") ||   # Next.js probes on a Rails app
    path.start_with?("/vendor/") ||  # phpunit and friends
    (path.end_with?(".xml") && path != "/sitemap.xml")
end
Blocked requests get a 403 from the middleware, Rails never routes them, and they never show up as a RoutingError. Cleaner logs, less load, and a smaller list of things to ignore.
Why I Turned It Off
Today, 22 April, I commented out the hourly job. The analyzer, GithubIssueService and the Fluentd accessory are next to go. Sentry and Scout APM, which were running the whole time, are enough.
Looking back, the idea was fine. The input was wrong.
Grepping logs for “error” is a bad error detector. Logs are written for humans. They’re full of the word “error” in URLs, query strings, expected failures, and other people’s bots. Sentry already catches real exceptions, groups them by fingerprint, and tells you when a new one appears. I’d rebuilt a worse version of the tool whose email I was trying to avoid reading.
One issue per hour of logs is the wrong unit. Deduplicating by log filename stopped exact repeats, but the same error in the next hour’s file was a “new” issue. The unit should be the error, not the time window.
An agent shouldn’t own its own filter. Asking Claude to fix bugs and to decide what counts as a bug meant most of its effort went into the second job. Ignore lists and blocklists are a human decision.
The GitHub Action is a first responder, not an engineer. It runs in a fresh checkout with no app running, no database, no way to reproduce anything. The deserialization fix worked because the whole story was in the stack trace. Anything that needs reproducing, like a race condition or a multi-step bug, is better done by running Claude Code locally, where it can actually run the app.
If I Built It Again
I’d still let Claude write the first fix. I’d change what wakes it up:
- Start from Sentry, not logs. Trigger on a new Sentry issue, so each bug arrives once, already grouped, with a real stack trace.
- One bug, one GitHub issue, one PR. Never a batch of everything that happened in the last two hours.
- Keep the filters human. Noise gets blocked at the edge with Rack::Attack, or ignored in Sentry, by me. The agent fixes code. It doesn’t decide what to look at.
- Keep bug fixes and housekeeping in separate PRs. Then a one-line crash fix doesn’t sit for nine days behind an ignore-list change.
Self-healing Rails isn’t a fantasy. For one bug on one Monday, it was real: an error at 10am, a correct fix with tests by 12:03, and I only had to press merge. Getting there every time is a signal problem, not an AI problem. The model was ready. The log file wasn’t.